Essential Charts for Finance & Investment Professionals - Made Easier With Power BI
Automate chart creation with 30+ investor-ready charts in one customizable, time-saving Power BI report template.
WORKFLOW AUTOMATION
6/24/20252 min read
In the fast-paced world of finance, time is money—and presentation is everything.
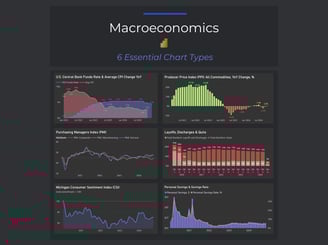
Whether you're working in investment banking, private equity, or macroeconomic research, clean and compelling data visualizations are a must.
But let’s face it: Excel charts often fall short on both aesthetics and efficiency. That’s where our Power BI Report Template for Finance & Investment Professionals comes in.
Streamline Finance & Investment Reporting with a Powerful Power BI Template
Why Switch to Power BI for Your Financial Dashboards?
1. Impress with Professional-Grade Charts
This Power BI report template offers more than 30 beautifully designed, professional charts. Whether you're preparing pitch decks, investor updates, or internal strategy reports, these visuals go far beyond what Excel can produce.
2. Automate Your Workflow and Save Hours
Instead of manually formatting each chart, simply plug in your updated data and Power BI handles the rest. The template is fully dynamic and customizable, meaning you get the flexibility of Excel with the automation and consistency of modern business intelligence tools.
Who Is This For?
This template is ideal for:
☑️ Investment bankers
☑️ Private equity analysts
☑️ Venture capital professionals
☑️ Corporate finance teams
☑️ Anyone looking to upgrade their reporting process with cleaner, automated, and more professional visuals.
Key Features:
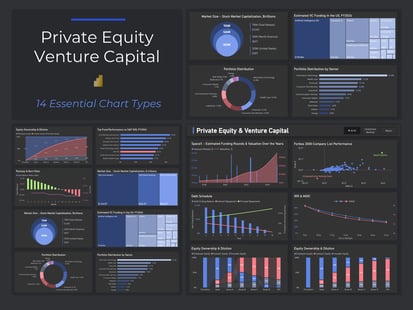
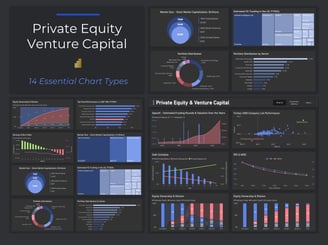
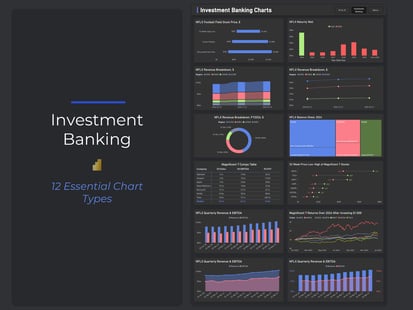
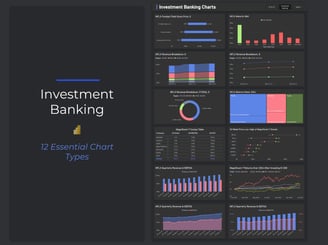
✅ 30+ Essential Finance & Investment Charts – Includes market comps, football field, treemaps, scatter plots and many more.
✅ Fully Customizable – Adjust inputs, labels, time frames, and visuals to match your specific reporting needs.
✅ No Design Skills Needed – Charts are already set up with high-end visual appeal, saving you the trouble of starting from scratch.
✅ Time-Saving Automation – Stop wasting hours adjusting colors and labels in Excel - Power BI handles it all.

Fraction of your time
Fraction of your cost
ALL The Benefits
Copyright 2024 © FractionBI
MB Smart Funding lt